By Ross E Curtis, Principal Scientist at AncestryDNA
Your DNA matches are a valuable tool for exploring your family history. You can use your matches and their trees to fill in gaps in your family research and discover shared ancestors. Additionally, your matches aren’t just related to you—they’re often related to each other, too.
In cases where you don’t know how you and a match are related, looking at how your matches are related to each other can help you make new discoveries. Features like Shared Matches and Enhanced Shared Matches can help you with this process. But, using these features can take a lot of effort and skill to figure out how all your matches are connected.
That’s why Ancestry scientists developed Matches by Cluster, a powerful new feature for Ancestry Pro Tools members*, that uses our exceptional DNA matching technology and some tailored algorithms to find connections between your DNA matches. Now, you can see how your matches are related to each other in an easily searchable visualization. Matches by Cluster helps you quickly go from saliva sample to family history discovery by narrowing down which family line(s) and ancestors you and your DNA matches share.
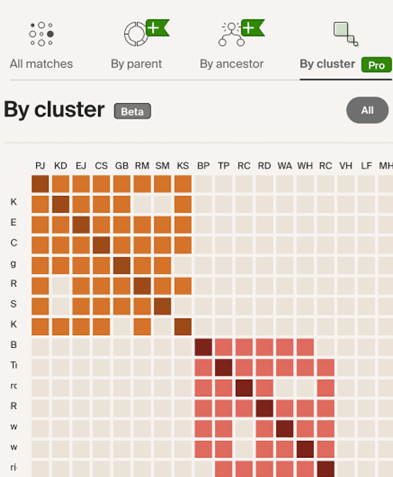
Interested to learn more about the science behind this new feature? Read on.
Mapping DNA Match Connections
Matches by Cluster organizes your DNA matches based on their relationships to each other. To do this, we start by mapping the connections between your matches and all of their matches. This tracks how you’re all connected and how much DNA you share.
In the example below, an AncestryDNA member is represented by a blue circle, and orange circles represent all their DNA matches. They’re connected by lines indicating how much DNA they share. The shorter the line, the more DNA they share and the closer the connection. The longer the line, the less DNA they share and the more distant the match. (When scientists talk about these kinds of maps they call them “networks”, and refer to the circles as “nodes” and the lines as “edges”. You can learn more about this science in our ancestral journeys white paper.)
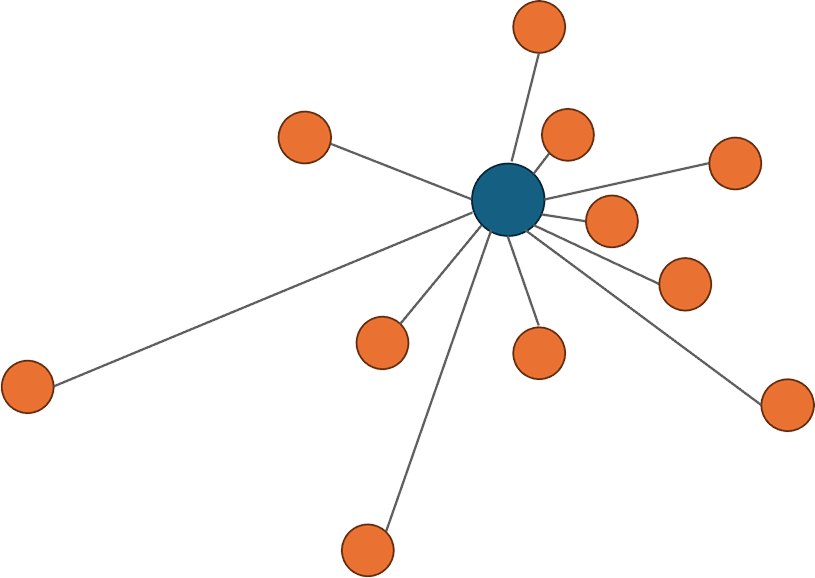
Figure 1. An example of how DNA matches can be mapped and connected. The center circle (blue) is the AncestryDNA member, and the outer circles (orange) are that person’s DNA matches in the Ancestry database. They are connected by lines that represent how much DNA they share. Shorter lines represent more shared DNA and, therefore, a closer match.
However, using all your matches can make the map of DNA connections very large and cluttered with matches who aren’t genealogically meaningful. So, we take a few extra steps to narrow down the matches we use. Below is a simplified illustration of the process.
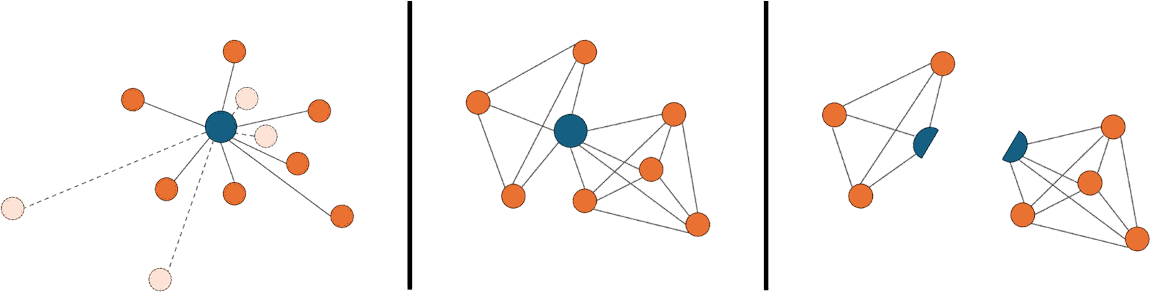
Figure 2. The main steps for mapping DNA match connections for clustering. First, we remove close relatives and matches more distant than third cousins (light orange) and then map your connections to them. Second, we determine how your matches are connected to each other. Then, we separate your matches into the two sides of your family—maternal and paternal. Lastly, we group the matches into their own clusters.
First, we remove your closest relatives (like parents, siblings, half-siblings, aunts/uncles, and nieces/nephews) and your matches who are more distant than third cousins. It may seem strange, but including close matches can actually make your clusters less meaningful. Because you and your close relatives share multiple ancestors, including them could blur important boundaries and result in one big cluster of matches.
For example, your siblings are equally related to all four of your grandparents and their descendants. If we included your siblings in the clustering, they’d act like a big magnet and draw into a single cluster all your aunts and uncles and cousins. The result wouldn’t be very interesting to look at or useful. By focusing on matches between 1st and 3rd cousins (people with whom you share between between 65cM and 1,300cM of DNA), we can form more clusters that are smaller and more informative. These clusters often contain matches who share an ancestor with you at the grandparent or great-grandparent level.
Next, we expand the map by determining how your matches are connected to each other. The more your matches are connected to each other, the easier it is to organize them into clusters that represent different family lines. At the same time, adding too many distant matches can make it harder to identify clear and meaningful clusters. Oftentimes, many distant matches are more a result of people descending from a common population. This can create a lot of connections between people, and disrupt the clustering, in a way that isn’t informative about your family history. After lots of experimentation, we’ve found a good balance by leaving out matches who are too distantly related—who share less than 20cM of DNA with each other.
Finally, we use SideView™ Technology to separate the map of your matches into two sides, representing the matches from each side of your family—maternal and paternal. This helps us build more accurate clusters. Matches who are “unassigned” aren’t placed into a cluster. Since we don’t know which family line they belong to, we don’t want to mess up the accuracy of your clusters.
Clustering Your Matches
Once we’ve mapped how your DNA matches connect to you and to each other, we use computer programs called clustering algorithms to find sets of matches who are more related to each other than to your other matches. At a technical level, clustering algorithms find strongly connected subsets of matches. Going back to our illustration above, this would look like a set of dots connected to each other by lots of lines, and separated from other sets of dots. You can learn more about one type of clustering algorithm, called the Louvain method, which we discuss in our ancestral journeys white paper.
There are many different clustering methods, each with its own strengths and weaknesses. For the best results, we use several and compare their findings. This approach is called an ensemble strategy. We also apply additional rules about how closely people are related when performing the clustering. This helps handle complex relationships created by endogamy or pedigree collapse, where people are connected in more than one way.
The result? Clear, organized clusters from each side of your family. You can explore these clusters, see how your matches are connected, and discover new family relationships.
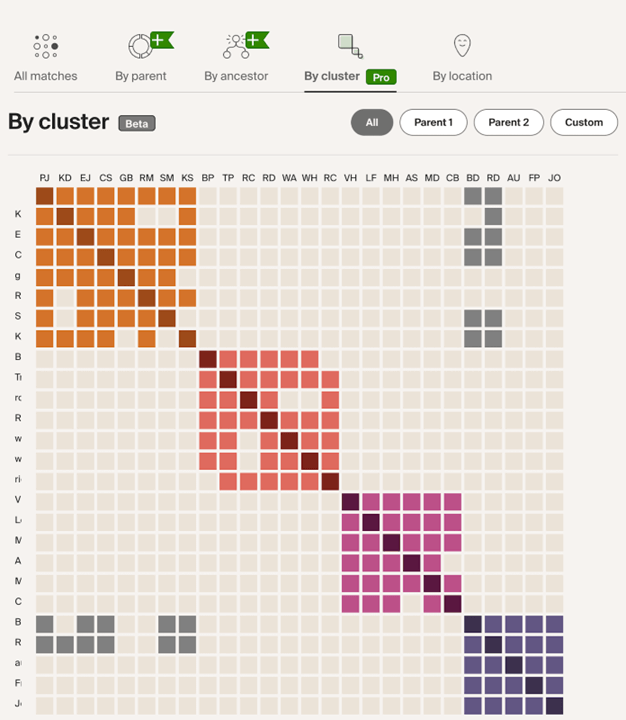
Figure 3. An example of the Matches by Cluster results Each colored square indicates a case where two of a person’s DNA matches also share DNA with each other. The clusters have been color-coded and represent individuals who likely share a common ancestor. Blank squares indicate where two individuals don’t share at least 20cM of DNA. Gray squares indicate where two individuals share DNA, but aren’r grouped into the same cluster.
Your turn to explore
Once your match clusters are ready, you can explore each one to discover which common ancestors those matches share. Click on any spot in the clusters to view information about the matches, or scroll down the page to look at the list of members in each cluster.
Matches by Cluster helps you visualize how your matches are connected by having them organized in front of you. You can use these data to identify likely shared ancestors and their related family lines, even if you don’t have historical records to show how they are related.
If you’re curious to learn how to make the most from your clusters, check out our related posts and virtual events.
*This DNA feature may requires an Ancestry Pro Tools membership. Some members will not be able to access this feature until December 2025.